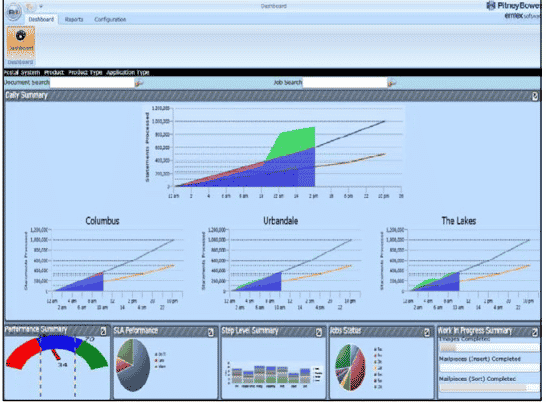
Enterprise Dashboard provides a browser based interface to represent active production summary, in real time, of all mail production sites with key metrics. This dashboard is required for executives to view the summarised views with current data to determine production status on time performance in real time.
Technologies:
Microsoft Silver light 2.0.C#,ASP.NET.
Dashboard:
- Enterprise dashboard is a browser based view with active data feed and updates from DFWorks system at mail production site. It is part of the Enterprise website along with reporting and configuration with P/I Look
- Dashboard is a single view summarising the key production metrics. Dashboard will not be showing individual job level or mail piece or machine/operator level detail.
- Dashboard shows current production data in reference to defined targets and comparing metrics site by site.
- Dashboard information is summarised at production groups(DPR, Cycles, etc), departments (print & insert)for the current day based on work in process.
- Dashboard is accessed by authorized users only.
- Dashboard implementation is flexible to add/support data from other systems.
Custom Controls:
- Custom Graph Control called Ski Sloped control was developed which plots a Target as line graph and the achieved data as an area with the area colored as red if the achieved point is below target and as green if achieved point is above target and remaining area with blue.
- The SKi Slope graph also draws a horizontal dashed line for the every target point plotted.
- Another Customer Control with a stacked column chart developed to plot different data for a similar set of states.
- A benchmark gauge control was also developed with plots an arc of around 150 degrees. which divides itself into segments based on the face color start and end points and also filling the area with relevant color specified,
- The benchmark control has needle drawn between the arc to show the value reached.
- It animates itself when constant data is pushed and updated to the bench mark value and depicts the value on the control.
- Defined a custom theme which has the same look and feel as of Windows Vista.