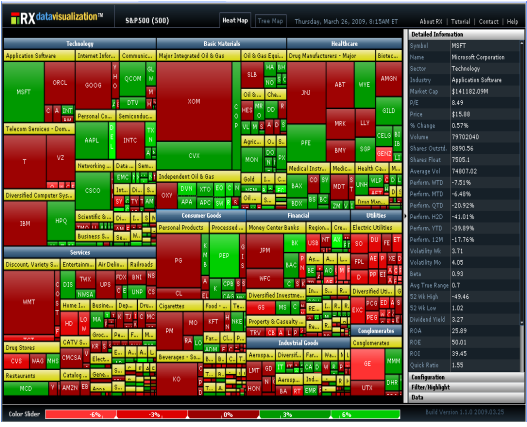
Adobe Flex/ AIR tool for Market Heat Map/ Tree Map, Heat Map tool is developed with all the Web 2.0 features. This application displays Market Data elements in intuitive format. Assign various parameters of the Market Securities’ and gain a visual map of these parameters over huge cross section of data sets such as S&P500, Russell 3000…. Etc.
Technology:
Adobe Flex 3.0 & AIR UI, Java, Spring, JMS, XML, Market Data API, Derby, MySQL
Key features:
- Assign and change the Color coding dynamically to the Map for greater clarity and visualization.
- Assign varying levels of Information display for Mouse over Pop Ups.
- Flexibility to assign different levels of Right Mouse Menu items (Charts, News, Options … etc.).
- Flexibility to show varying levels of Information on each element presentation in the Visual Map.
- Dynamically access the Data Sub-sets’ elements with single mouse click.
- Integrate with the Real time Price feeds to update the Map real time
Key functionalities:
- Create Dynamic grouping and Un-grouping of the data.
- Configure the Data parameter assignment on the fly with instant visual presentation of the data.
- Filter or highlight the Data sub sets that fits the specific criteria.
- Build Filtering/ Highlighting criteria dynamically.
- Visualize Data in a graphical map or Data Tree with a single click.
- Visualize data as Heat Map or Tree Map, export the data in .CSV format.
Key application scenarios:
- Display on web pages or finance portals to display market data of a portfolio or Indices & its constituents.
- Display market prices for various securities such as Equities, Currency rates, Commodity Markets etc.
- Analytical comparison of huge data sets and varying data elements.
- Plot real time spreads map of Options Data.
- Map Index Constituents or ETF member stocks to identify performances or other parameters.
- Visual presentation of end of the day or snap shot of Market summaries.